flexdashboard
flexdashboards allow users to create R dashboards using Markdown. Our example, Fiji Earthquakes is a sample R flexdashboard showing data from the R quakes dataset. It uses Leaflet, ThreeJS, and ggvis.
Transforming Your Enterprise through Data, Insights, & Analytics.
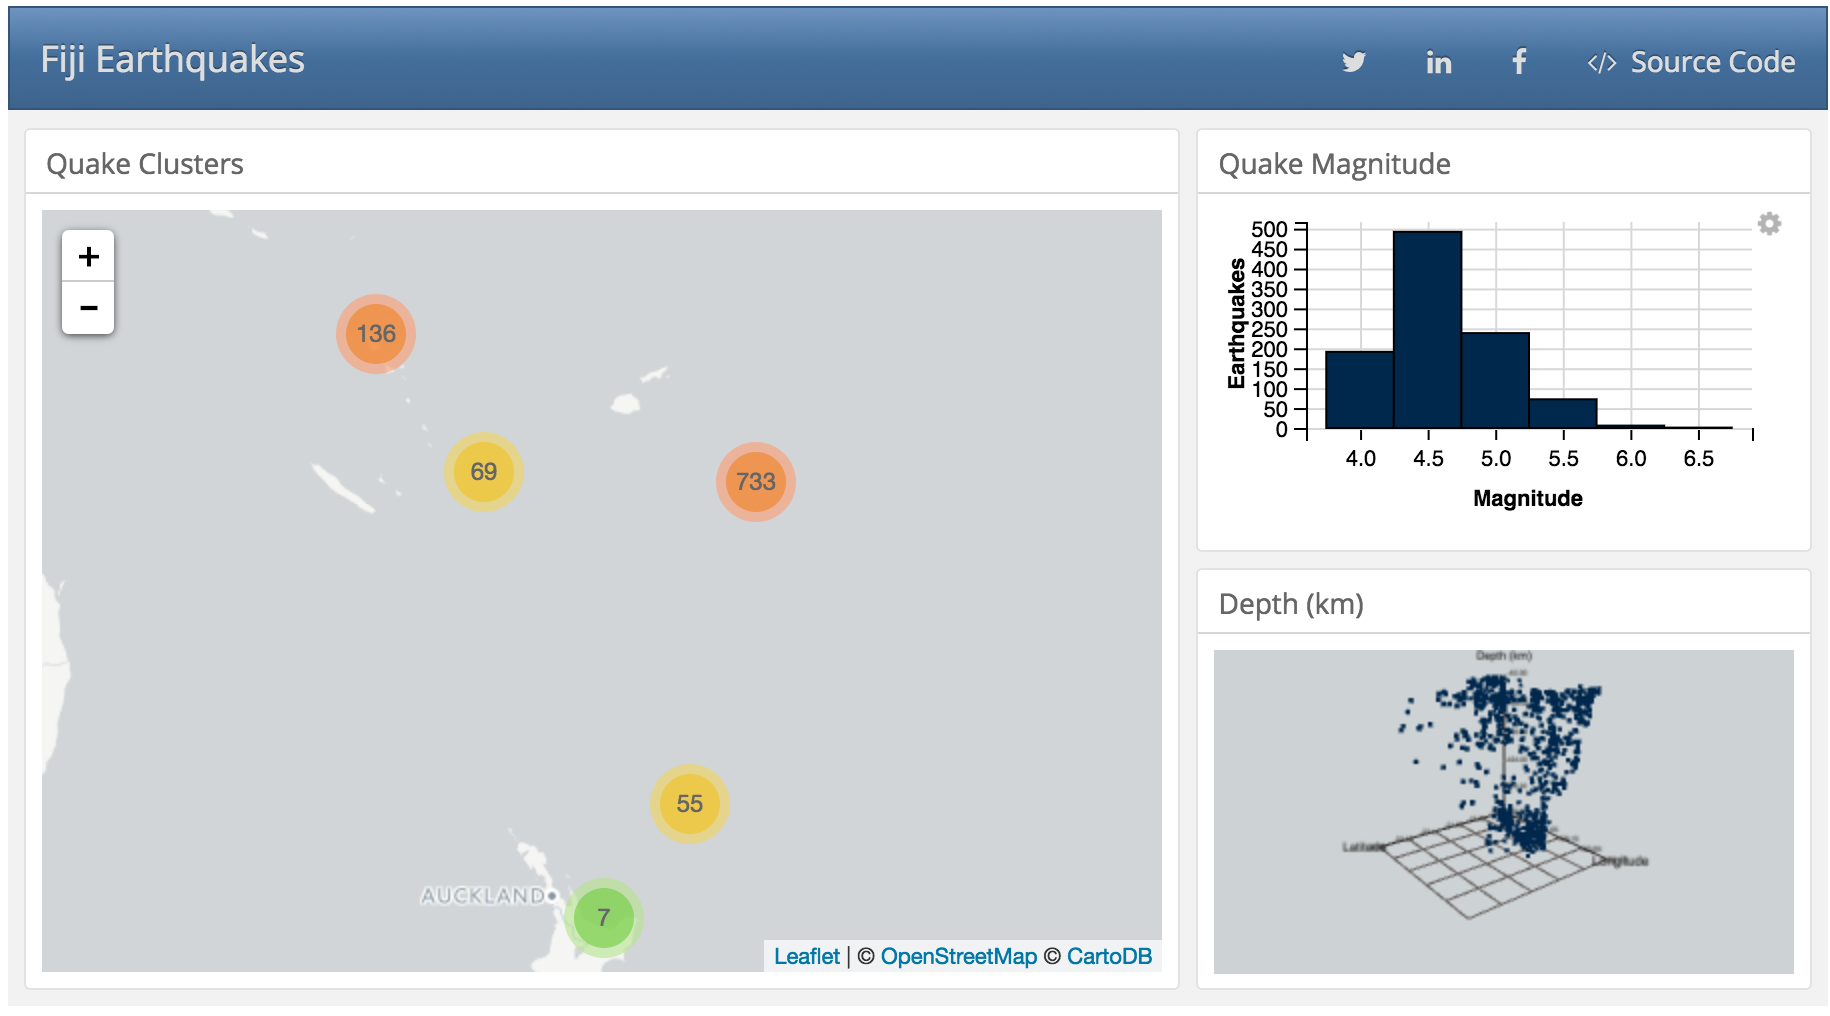
flexdashboards allow users to create R dashboards using Markdown. Our example, Fiji Earthquakes is a sample R flexdashboard showing data from the R quakes dataset. It uses Leaflet, ThreeJS, and ggvis.
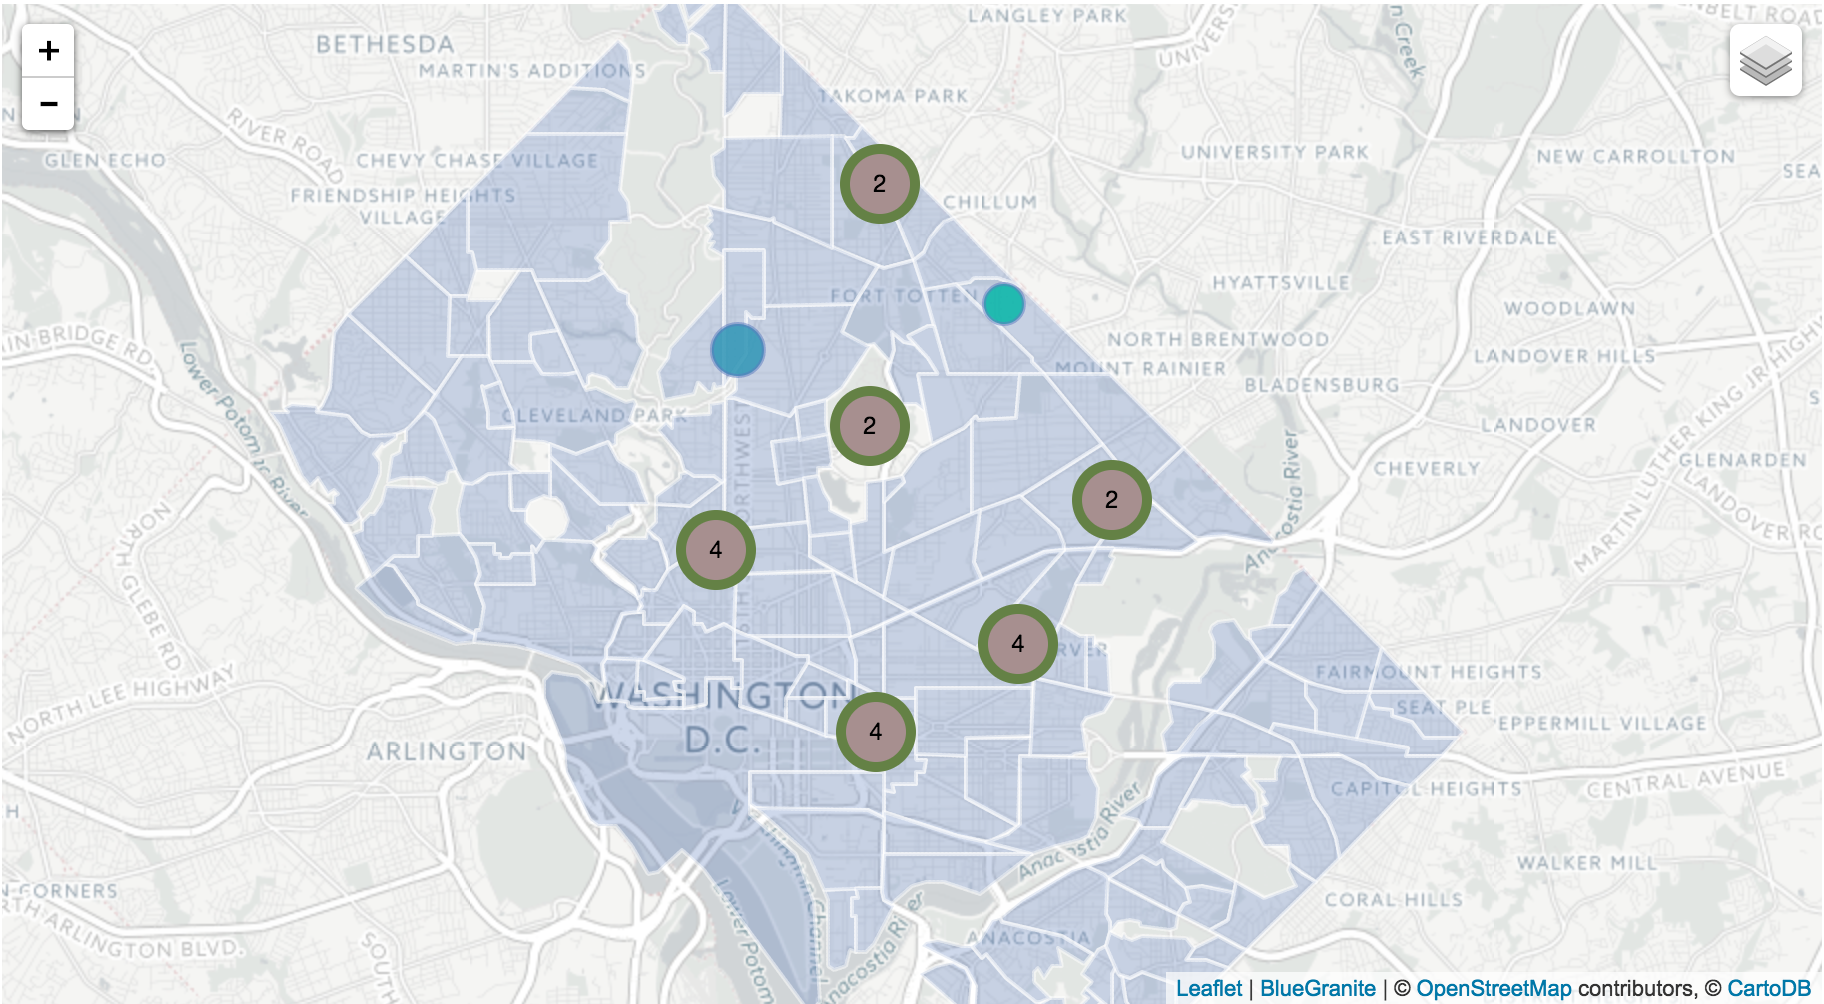
Leaflet is a JavaScript library for creating interactive maps. Our example, Utility Outage Clusters is a Leaflet map showcasing marker clusters. As you zoom out, circle markers that represent individual outages converge into clusters. Outage data was fabricated for twenty outages and represent locations around Washington DC.
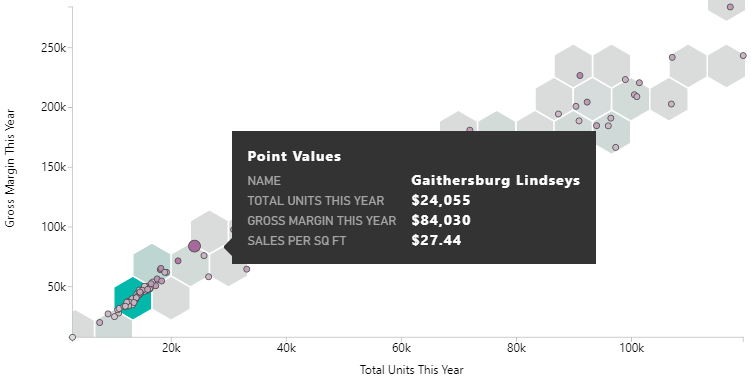
The Hexbin Scatterplot is a custom visual for Microsoft Power BI that displays points on top of hexagonal "bins". Color saturation for the hexbins shows the density of points within each bin, with darker bins showing more points.

Based on the DT package, rDataTable is an interactive Power BI R custom visual that helps you easily explore table data. It is pending approval in the Office Store / AppSource.
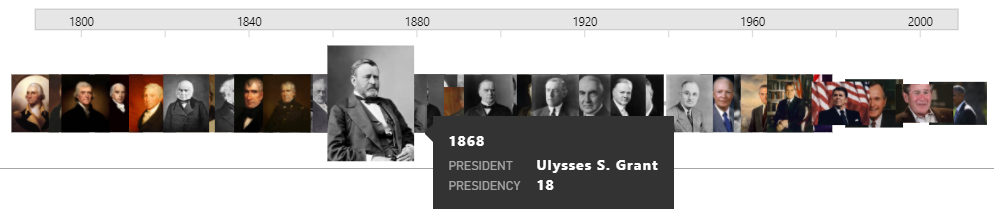
The Image Timeline is a custom visual for Microsoft Power BI that displays events along a horizontal timeline. Events appear as either circles or custom images.
BlueGranite offers training in many areas from data visualization to advanced analytics. Below are the Github repositories that correspond to our training offers.
Kick start your advanced analytics practice with a short workshop. Your team will learn new data science skills plus facilitate a brainstorming session around the potential for machine learning and big data in your organization.
Combine the power of R with parallel computing with Microsoft ML Server. This training will help your team unlock the distributed computing fuctions of the RevoScaleR and MicrosoftML R packages.
Learn Python skills relevant to a data science workflow. From data ingestion, manipulation, visualization, and machine learning, this training helps your team members kick start a strong Python skillset.
Through this curriculum based approach with hands-on labs and in-person guidance, attendees will be able to build and share stunning visualizations and valuable data insights quickly and easily with Power BI.
We provide architecture, design, development, training and support for both mid-market and enterprise clients across the U.S. BlueGranite’s “think big, but start small” philosophy helps our clients embrace data as a strategic asset. With our unique framework, we create roadmaps, build solutions, and deliver value across organizations.
Our “let’s get real” approach helps you easily identify issues and solve them with a variety of Cloud Analytics solutions, from predictive analytics and machine learning, to data lakes and self-service BI.
Contact us today and we'll be happy to help!